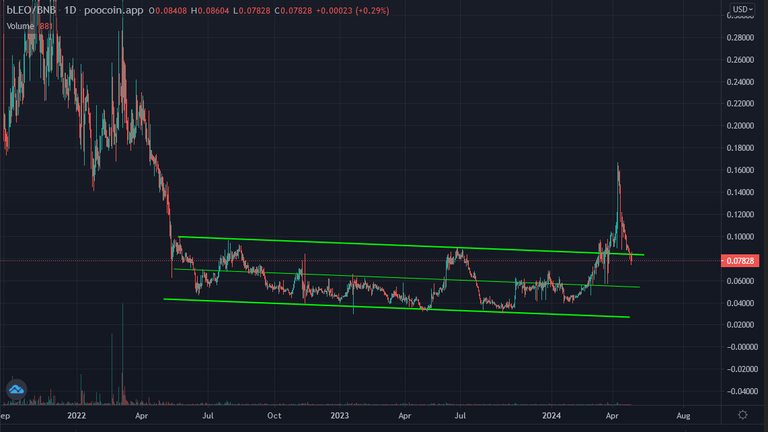
There is pyramid pattern on LEO Price chart. After reaching 0.16 USD, Leo price went down to 0,07 USD. Even it is down 0.5x, It is not very bad performance. Lots of altcoins are down more than LEO. LEO price chart seems as a pyramid.
There was a consolidation zone on LEO price chart and LEO price broke up this zone after a year. Now, LEO price is trying not to enter againg this zone.
Here you can see daily chart of LEO. After supporting the middle line of consolidation zone, LEO could break up the top line of consolidation zone. It will be very possitive if LEO achive not to enter again consolidation zone.
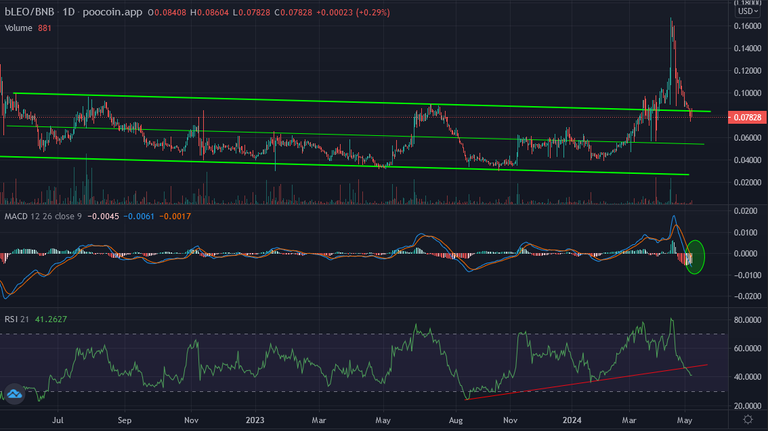
Here you can see the indicators on daily LEO price chart. There was a support line on RSI Indicator. It is broken down. MACD Indicator is trying to reverse from the bottom. If it reverses, price dump will end. I hope LEO price will be supported by the top line of this zone and not to enter in again..
Even LEO price went down, it did not enter this zone. I think It is great bullish signal for LEO.
We will see..

